
The displacement of the Greek Cypriot population from the northern part of Cyprus, which was caused by the occupation of the Turkish army, in the summer of 1974, was the starting point for the alteration of the demographic composition in this part. Greek Cypriots were replaced by Turkish Cypriots that left the southern part of the island, but also by large numbers of Turkish citizens who were transferred as settlers to the evacuated communities.
In addition to standard approaches for vote analysis, based on social and economic criteria, an important factor that determines the vote in our case is belonging to one of these three groups:
- Turkish Cypriots who traditionally lived in cities and communities to the north of the line dividing the island.
-
The Turkish Cypriots who moved from the southern part of the island.
- The Turkish settlers established in cities and communitities in the north after 1974.
A fairly clear separation of the three groups existed in the 1980s, even though in some communities a mixed population existed. Over time a greater contact between populations has developed, although a significant number of settlers communities are still living isolated to a certain extent.
In order to study the vote, we grouped the communities by taking into account the above situation:
- First, we consider the cities of Lefkosia and Famagusta as separate urban entities. Lefkosia clearly features the characteristics of urban behavior, in combination with the relationship that a significant number of citizens have with the power-holders, as employees, as well as possible contact to new ideas, and other elements that differentiate cities from the countryside. It had 30.000 registered voters in 2015.
-
The vote to the settlers party YDP reached 3%in some quarters of the town, with a spike to 8% in Karaman Zade. A significant number of settlers were living in the old town in the 1980s.
-
- Famagusta is a special case. Until 1974, its population lived ‘trapped‘ in some way within the city walls and in the Sakaria quarter. Subsequently, Turkish Cypriots from Paphos and other places settled in various areas of the town. Also the entire west neighborhoods are inhabited by settlers from Turkey (Harika, Anadolou), while we note their significant presence in other quarters as well. Their vote to YDP varied from 44% to 72%.
- In a third category (TC60) we have grouped all the communities that according to the 1960 census had a purely Turkish Cypriot population, as well as some mixed ones with a relatively large proportion of Turkish Cypriots compared to Greek Cypriots. They had 36,000 registered voters in 2015. The biggest community in the group is Gonyeli, with 12,000 voters. In 13 of its 60 communities the vote to YDP was over 2%, where in Kouklia and Ayios Symeon it reached 4.5%.
In order to group the rest of the communities, where Turkish Cypriots from the southern part of Cyprus or from Turkey have established, we used the settlers’ vote for the Renaissance Party, RP – YDP, in 1985. It was the only election that the party contested on its own. It secured 8% of the vote, which simply indicates that the settlers, who have a greater presence in the population, voted in their majority for conservative right-wing parties. The size of the settlers’ vote in each community is an indication of the density of their presence, as well as that of others Cypriots. By ‘others’, we are referring to Turkish Cypriots from the south.
Without claiming that this is an indisputable choice, we divided the communities as follows:
- The group of communities beyond the above three categories, with a percentage for the settler party of up to 2% is considered to be inhabited exclusively by Turkish Cypriots, with few exceptions, due to mixed marriages mainly or other reasons. There are 24 communities in the group, which total 12,000 registered voters (2015), Lyssi (1900) and Yialoussa (1360) are the largest. In eight of the communities, the YDP received between 1% to 2%.
- In 30 communities the Renaissance Party won 2-10%, which indicates a large majority of Turkish Cypriots, with a settlers presence of up to 20-25%. They total 37,300 voters in 2015, with Kyrenia, Morfou and Karavas being the largest ones. Their respective vote to YDP was 3.7%, 4.7% and 6%.
- When the vote to the settlers’ party is between 10-20%, we assume that we are close to having an approximately equal presence of settlers and Turkish Cypriots. There are 19 communities in the group, totalling 20,000 voters. Lapithos, Kythrea, Yerolakos, Vatyli, Trikomo and Ayios Sergios are the largest of them. Lapithos vote to the YDP was 16%, while Yerolakos reached 20%.
- A vote of 20-30% is noted in 15 communities, which points to a clear majority of settlers. Four communities, Assia, Vasilia, Ayios Amvrosios and Mia Milia had between 1000-1200 voters from a total of 8000. In the last two, YDP received 27.5%.
- When the settler party vote exceeds 30%, the community has an exclusively settler population. This is the case in 30 communities, mostly small or medium size ones. They total 12,000 registered voters in 2015, with Rizokarpaso (1700) and Akanthou (1160) being the largest ones. Rizokarpaso vote to YDP was 40% and Akanthou slightly over 30%. In 13 out of the 30 communities, YDP received between 50% and 88%.
We have cross-referenced data above with other sources on the composition of the population. Also, when comparing the results for the settlers party, YDP in 1985 with the vote to Nuri Çevikel a settler presidential candidate in 2005, we reach a high correlation factor, despite the 20-year time distance and differences between the two contests.
The relevance and consistency of results confirm the reliability of our method.
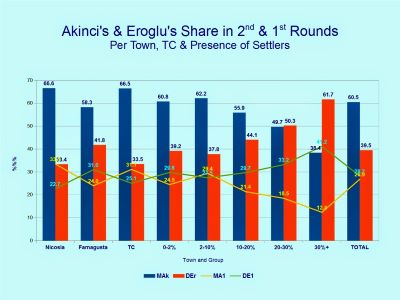
The characteristics of the communities groups are summarised as follows
|
Name |
Voters (2015) |
YDP vote |
Characteristics (basic) |
|
Lefkosia |
29593 |
<3, KΖade 8% | Urban, small number of settlers |
|
Ammochostos |
21416 |
5/14 quarters 44-72% | Many settlers, TC60, TCsouth |
|
TC60 |
35841 |
>2% in 13/60 comm.
Max in 2 =4.5% |
60 communities, only TC 1960, Gonyeli =12,000 |
|
0-2% |
12280 |
1-2% in 8/24 comm. | 24 communities TC from south |
|
2-10% |
37384 |
From 2 – 10% | 30 communities (Kerynia, Morfou, Karavas) majority TC from south |
|
10-20% |
20061 |
Lapithos 16%
Kythrea, Yerolakos 20% |
19 communities, aprox. Equal TC from south – settlers |
|
20-30% |
8454 |
15 comm., Mia Milia Ayios Amvrosios, 27.5% |
Settlers a majority over TC from south |
|
30%+ |
11887 |
30 comm., Akanthou 30%, Rizokarpaso 40%, 13 comm. 50-88% | Exclusively (or almost) settlers |